The earthquake that occurred in North Texas in the wee hours of the morning was the 8th quake in 5 weeks for that same area. I think we call that a cluster.
- 2.7M July 6th with map
- 2.3M June 5th
- 3.1M June 15th with map
- 2.6M June 23rd with maps
- 3.5M June 24th
- 2.6M June 26th
- 2.3M June 30th
Gas Patch residents who live in zones of extraction should routinely document the condition of their foundations and walls. This documentation may be important one day for a class action suit like the one in Arkansas.
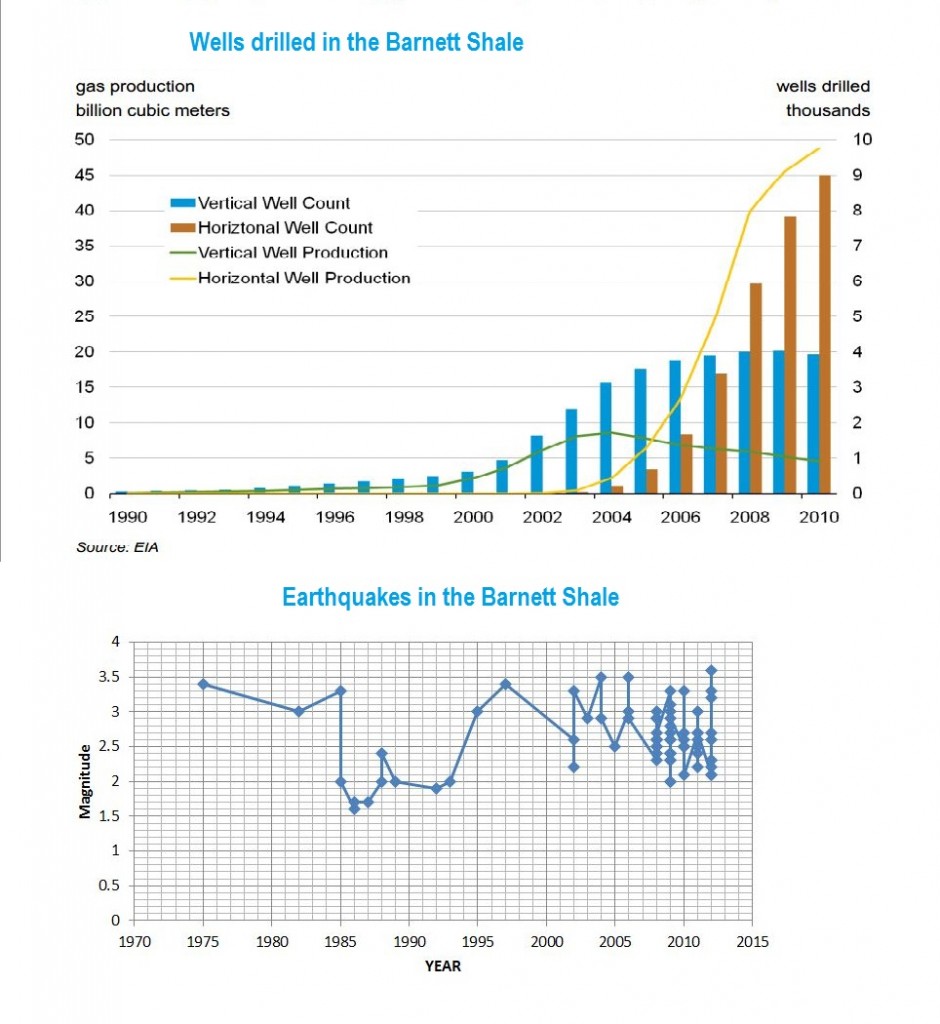
Update: Charts from a reader.

About Sharon Wilson
Sharon Wilson is considered a leading citizen expert on the impacts of shale oil and gas extraction. She is the go-to person whether it’s top EPA officials from D.C., national and international news networks, or residents facing the shock of eminent domain and the devastating environmental effects of natural gas development in their backyards.
- Web |
- More Posts(5122)
Data for second graph:
http://neic.usgs.gov/cgi-bin/epic/epic.cgi?SEARCHMETHOD=3&FILEFORMAT=4&SEARCHRANGE=HH&CLAT=32.67222&CLON=-97.3486&CRAD=200
Are these near fracking sites or injection well, or perhaps both?
Lots of both.
Have friends that live up by Krum – shook them up
Probably due to a clusterfrack – too much fracking waste
It would sure be interesting to get a glimpse of the production logs from some of the O&G wells in area surrounding those quakes.
We do know that earthquakes can cause an up-tic in production in oil wells; but that’s essentially all we know at this point.
It seems like the injection well operators there in Cleburne might now be getting things truly “dialed-in”. Somewhere right between 2.5 and 3M seems to be just about right. Once or twice a week seems to work fine.
I hope I’m wrong. I hope these induced seismic events are not being induced intentionally. I hope you’ve seen the last of this sort of thing there in N. Texas and throughout Gasland.
And I hope the Israelis and Palestinians can patch up their differences soon also. After all, it’s a small world.